This summer, after a two-year hiatus, SPUR resumed its annual study trip to learn from other cities around the world. See the bottom of this page for links to all our articles about this year’s trip to Copenhagen.
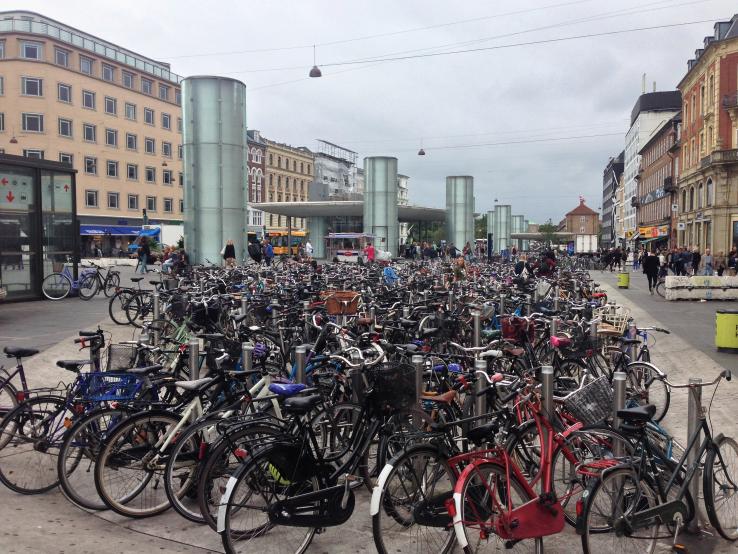
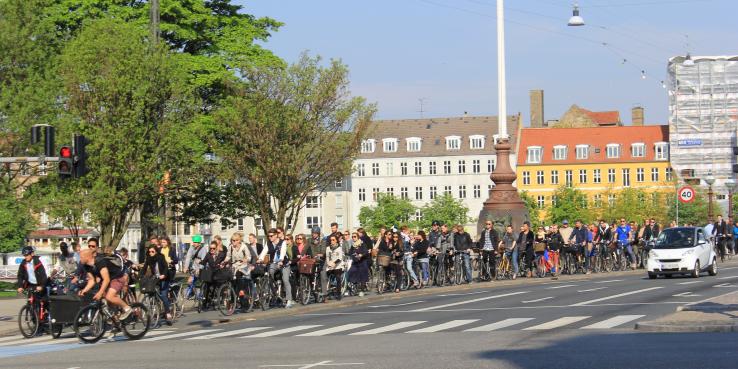
Bicycles and bicyclists are among the first things you notice when you arrive in Copenhagen — there’s an endless sea of bikes parked at every major train station plaza and lined up along every building. Cycling is in fact the dominant form of transportation and makes up nearly 50% of commute trips. Bikes outnumber cars five to one, and 26% of families with two or more children have a cargo bike.

It would be easy to dismiss Copenhagen’s bike infrastructure and usage as an impossible dream with little relevance for Bay Area policy-making — a familiar US policy response to successful European models — but that would be a mistake. Though our region has a long way to go, Bay Area cities can take relevant lessons — and inspiration — from Copenhagen’s bicycle planning history, its pragmatic approach and its regional aspirations.
Copenhagen hasn’t always been a bicyclist’s Mecca. In the mid-1950s, the city began to face some of the same challenges as American cities. In the post-war era, Copenhageners fled to the suburbs seeking more space and retreating from urban challenges. Car ownership exploded and, in response to increasing congestion, Copenhagen took steps to eke out more space for cars. We are all too familiar with the result: more congestion, more dangerous streets, fewer people biking, more urban flight and a vicious cycle much like the one that directed the modern urban landscape in many parts of the United States.
Copenhagen can serve as a model for Bay Area cities in part because it consciously clawed its way back from this low point, driven largely by public outcry and protests about safety, air quality and inconvenience resulting from automobile traffic. Admittedly, even at its low point, Copenhageners took about 10% of trips by bicycle, still nearly double the rate of most bicycle-friendly U.S. cities. (In San Francisco, for example, between 3% and 4% of trips were taken by bicycle before the pandemic.) But from this 10% baseline, bicycling in Copenhagen has grown to 49% of commute trips and become the dominant mode of transportation through methodical, practical improvements.
How It All Began
Copenhagen’s shift toward biking began in the early 1970s. The oil crisis required an alternative to driving, and meanwhile public frustration and activism were growing around air pollution, the dangers of bicycling amidst increased traffic and cars consuming too much space for parking and new travel lanes. Plans to build elevated freeways had been picking up pace when fuel shortages and public outrage turned attention back to making things work for bikes.
Today public interest in cycling — and an aggressive government agenda to support it — are driven by other factors. In urban areas, the network has become sufficiently safe and complete that it is now the preferred transportation mode for many. When asked why they choose to bike, 55% of Copenhageners say because it’s easier than other modes of travel and 46% say because it’s faster. More than 77% of Copenhagen say they feel safe cycling in traffic, and 83% are satisfied or very satisfied with “Copenhagen as a cycling city.” (These and more statistics can be found in Copenhagen’s Cycling Account.) At this point, there is such a critical mass of bicycle commuters that it is a political necessity to be responsive and supportive of this constituency.
Copenhagen’s sustainability goals have become another major driver for cycling interest and government investment and promotion. The city’s high bicycle usage is pitched by both the government and advocates as a vital tool to meet climate goals. Copenhagen has committed itself to becoming carbon neutral by 2025, and the city has pitched its growing percentage of trips taken by bicycle as one of the essential implementation tools of this vision. This has been the driving factor behind more recent efforts to broaden cycling interest and increase cycling rates outside of urban areas, where the shift to widespread bicycle use hasn’t been as successful. In fact, outside of Copenhagen proper, cycling has been declining for years.
Enter the Cycle Superhighways
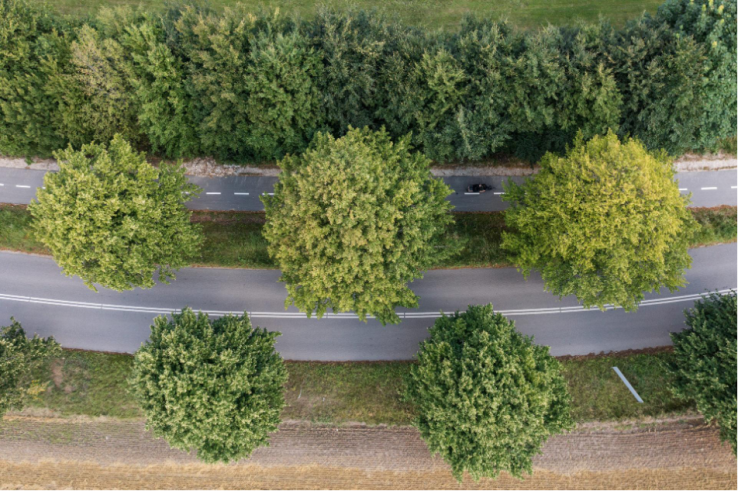
Copenhagen’s policymakers were unwilling to accept this decline in cycling as a simple reality of suburban life. Since 2012, CO2 emissions in the Capital Region of Denmark — the 1,000 square mile region that includes Copenhagen — have increased by 12%, and one fourth of the region’s population is not meeting the World Health Organization’s minimum physical activity targets. Policymakers realized they needed an approach that makes cycling work for longer distance trips in lower density areas where driving and transit are more typical options. So Copenhagen and the Danish national government partnered to develop the Cycle Superhighways Plan for the Danish Capital Region.

In 2008, Danish transportation planners conceived an idea for a bicycle superhighway network, a coherent regional network of cycling-only highways that would provide a safe, smooth ride between cities with few stops and increased safety. Within three years, the Office of Bicycle Superhighways was created to set standards, create a long-term plan and coordinate among jurisdictions to weave together fragmented existing routes. The plan now calls for 60 routes adding up to more than 510 miles of bicycle superhighways, with about 150 miles built to date.
The design standards are built around four key criteria:
Accessibility — highways are easily identifiable and connect directly to residential, business, education and transit hubs
Directness — the network provides the fastest possible connection with the fewest stops possible
Comfort — highways offer smooth routes with a high level of maintenance
Safety — highways provide both physical safety and the perception of safety
Though the plan is less than one-third complete, it’s having an impact, with an average increase of 23% of cyclists on each superhighway route through 2018. (This increase is measured the date each route opened until 2018.).14% of new users stated that they formerly traveled by car. Cycle superhighway users have an average trip length of 6.5 miles and 18% ride e-bikes. Overall, the network’s benefits are more than 2.5 times its costs, primarily due to health benefits such as fewer sick days and reduced mortality rates. These and more outcomes can be found in the Cycle Superhighways Bicycle Account.
As part of their pitch, bicycle superhighway planners have featured riders who are very relatable, for example, a 40-year-old mom with two kids who is “not a super cyclist,” just someone who wants to fit exercise into her schedule, enjoy her trip to work with her children and feel good about her commute choices.
Lessons for the Bay Area
Copenhagen offers rich examples for bicycle planning in cities such as Oakland, San Francisco, and San José, and for the Bay Area region as a whole. Of course, some elements of Copenhagen’s model will be harder to replicate. Most significantly, during our tour Copenhagen policy makers repeatedly noted the high level of public trust in government — a criterion that is in short supply in many Bay Area cities, though as discussed below, this can change. Far less changeable are the Bay Area’s topographical challenges, which flat Copenhagen lacks. And bicycle theft is, by comparison, a negligible factor in Copenhagen; most bikes have a small wheel lock as a minor deterrent, and many others are not locked at all. But the Bay Area also has significant advantages over Copenhagen, not least a climate that is far more amenable to year-round cycling.
Lesson 1. Invest in a regional cycle superhighway network.
The Bay Area should invest in making cycling practical and attractive for the areas outside of city centers, where bicycle commuting rates are typically far lower. This would require more significant investment in the region’s active transportation network, and a well-resourced office whose job it is to support coordination across jurisdictions to ensure continuous corridors and consistent standards. It’s not hard to imagine a Bay Area campaign to deliver a predictable high-quality bicycle experience on a few dozen major regional routes that connect to our major job and commercial centers. In fact, MTC just last month approved a Regional Active Transportation Plan and Active Transportation Network, designed to “provide a convenient, safe and comfortable choice for people of all ages and abilities to bike, walk and roll.” MTC funding programs will prioritize projects located on the Active Transportation Network. Similar to the Danish cycle superhighways, this plan seeks to weave together county and local active transportation plans to make continuous routes that cut across many jurisdictions. Though cyclists will need to be satisfied with a transit shuttle link over the Bay Bridge, many other routes across the region could be developed with more consistent standards. As our region begins this implementation, Copenhagen’s cycle superhighway plan should be a model for ambition, branding and funding commitment.

Lesson 2. Design the biking system to meet the needs of all riders — and to convert nonriders.
Bicycle planners should focus on practical convenience for cyclists in a way that makes it truly competitive with other modes of travel. Delivering separated lanes that accomodate a mix of recreational riders, parents with cargo bikes and high-speed commuters is a key example. Building continuous connected bicycle networks, with consideration for how cyclists get through complex intersections and traffic signals timed for cyclists, are also critical elements.
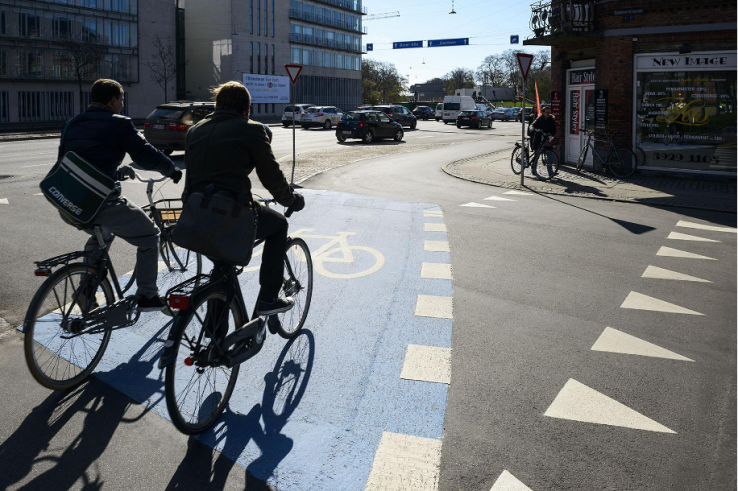
In Copenhagen, making space for bikes means far more than just bike lane striping. The standard approach involves creating a bike lane that is separated from traffic by several inches of elevation, creating a curb between the traffic and bike lane — but not as high as the neighboring sidewalk. This approach allows for clear separation from traffic, while not requiring additional space for bollards or a buffer zone. This is similar to the lanes that have been installed more recently in a number San Francisco corridors, such as 2nd Street through SOMA.

Nor does Copenhagen stop at simply creating physical separation between bikes and other modes of travel. In designing its bike system, the city focused on the needs of cyclists seeking both a practical and enjoyable experience. Bike routes are designed with enough width that two cyclists can ride side-by-side — friends can have a conversation, or a child and parent can ride side-by-side to feel safer — while still allowing room for a third, faster-moving cyclist to pass on the left. In addition to creating sufficient space for a variety of users, planners timed signals based on typical bicycle speeds. This means that cyclists traveling on major corridors often face a series of green lights as they move along their route, resulting in faster travel and less energy expended on starting and stopping. There are also smaller conveniences: a cyclist waiting at a red light can stabilize themselves by setting their foot on an elevated bar installed at the curb, and public garbage cans are set at an angle to allow a moving cyclist to drop their trash while in motion. Finally, the routes are continuous, meaning that one can travel long distances across the heart of the city using major thoroughfare bike routes, with additional markings guiding cyclists through busy intersections along the path that is safest and most sensible.

Copenhagen is deliberately trying to make bicycling the quickest and simplest option, so people will choose it for that reason and not based on ideology — even though it also happens to be the best choice for public safety, climate, air quality and public life.

More photos available at https://supercykelstier.dk/presse/
Lesson 3. Use bike projects to build trust.
Copenhagen city government has built public trust by competently and consistently delivering bicycle infrastructure, making steady, incremental improvements that show immediate tangible benefits without provoking strong opposition. For example, to create needed space for bicycles, the city has a policy to remove 200 parking spaces per year across the whole of Copenhagen, which translates into removing only two to three parking spaces per neighborhood per year. This approach minimizes opposition while demonstrating immediate benefits that build support for future changes.
Major cities such as Oakland, San Francisco, and San José should also see bicycle infrastructure delivery as a unique opportunity to build trust in local government. Why is bicycle infrastructure the place to build trust? First of all, bicycle projects are generally much faster to build than other transportation projects, and thus show results more quickly. And our cities have shown they can deliver. For example, SFMTA delivered nearly 18 miles of new or upgraded bikeways in 2021, following more than 15 miles in 2020 (in addition to 34 miles of new Slow Streets). SFMTA has been nimble with designs, and capable of delivering top notch, separated lanes successfully designed for all ages. Oakland and San José have also quickly delivered dozens of miles of bicycle lanes in recent years. While other pressing needs such as increasing housing production, reducing the number of people experiencing homelessness, and delivering major new transit infrastructure all require attention and major progress, such initiatives are extremely complex and will face extraordinary challenges. Delivering bicycle infrastructure may be the best place for our cities to begin building Copenhagen-style trust in government, which could be a place to start toward making progress on everything else.
Read more about the study trip:
The Sustainable City: Learning from Copenhagen's Plan for Zero Carbon
Finding a Way to Build: Can the Bay Area Learn from Copenhagen’s 1990s Reinvention?
